cropper
update

DYLBO Smart Marketing

for Local Business

cropper
update
  • Home
  • Categories
    • Smart Marketing Strategy
    • Local SEO & Visibility
    • Content & Authority Building
    • Funnels & Lead Generation
    • Paid Ads & Campaigns
    • Social & Video Marketing
    • Reviews & Reputation
    • Sector Marketing Guides
    • Smart Marketing News
  • Smart Marketing Services
  • DDM on Facebook
    update
  • DDM on X.com
    update
  • DDM Google Business Profile
    update
  • DDM on LinkedIn
    update
  • update
  • DDM on Youtube
    update
  • DDM on Instagram
    update
July 05.2025
1 Minute Read

Customer Segmentation Tips for Instant Results

Did you know companies embracing advanced customer segmentation experience, on average, a 10% boost in both customer retention and profitability? That’s not just a number—it’s the edge empowering forward-thinking brands to build stronger connections and skyrocket their results overnight. In today’s fast-paced market, learning the secrets behind segmentation can elevate your marketing strategies, maximize ROI, and transform average campaigns into precision-guided successes. If you want practical, actionable segmentation tips that deliver instant results, you’re in the right place.

Revolutionizing Success: Why Customer Segmentation Delivers Unmatched Results

Did you know companies using advanced customer segmentation strategies report an average of 10% improvement in customer retention and profitability? – Harvard Business Review
  • Personalized targeting
  • Increased ROI
  • Enhanced customer experience
  • Streamlined marketing spend

customer segmentation professionals collaborating over segmentation charts in a modern workspace

Using customer segmentation is one of the most powerful ways businesses can revolutionize their market success. The process helps you break down your vast customer base into meaningful customer segments —each with unique behaviors, needs, and preferences. By analyzing and targeting these segments based on demographic, geographic, psychographic, and behavioral data, companies can deliver highly personalized messages that truly resonate. This precise targeting doesn’t just increase brand loyalty and conversions; it makes every dollar in your marketing campaign work harder for you.

With competition at an all-time high, streamlined marketing spend and increased ROI aren’t just nice-to-haves—they’re a necessity. When your marketing strategies are guided by clear, actionable insights about each customer segment, you’ll notice an immediate improvement in the relevancy of your campaigns and the efficiency of your spend. Plus, an enhanced customer experience means higher retention, positive word-of-mouth, and lasting business growth.

What You Will Learn About Customer Segmentation

  • The foundations of customer segmentation
  • Proven segmentation models and strategies
  • Step-by-step process to segment customers effectively
  • Real-world market segment analysis examples
  • Common pitfalls and expert tips for quick wins

Understanding Customer Segmentation: Concepts and Core Principles

What is Meant by Customer Segmentation?

Executives discussing customer segmentation data in a modern business meeting

Customer segmentation is the process of dividing your customer base into distinct groups based on common characteristics such as demographics, interests, buying patterns, and location. This powerful technique allows businesses to target specific segments with tailored messages, ensuring that the marketing strategy speaks directly to the needs and preferences of each segment. By clustering your audience into customer segments , you can intelligently allocate resources, enhance customer experience , and boost engagement with your product or service .

Segmentation isn’t just about separating customers into groups; it’s about understanding the deeper motivations and needs driving customer behavior . This clarity enables organizations to build more effective campaigns, develop relevant offers, and foster loyalty long-term. Whether you’re a retailer aiming to drive sales, a SaaS company looking to improve retention, or a travel agency wanting to personalize recommendations, segmentation is the key to unlocking your full potential.

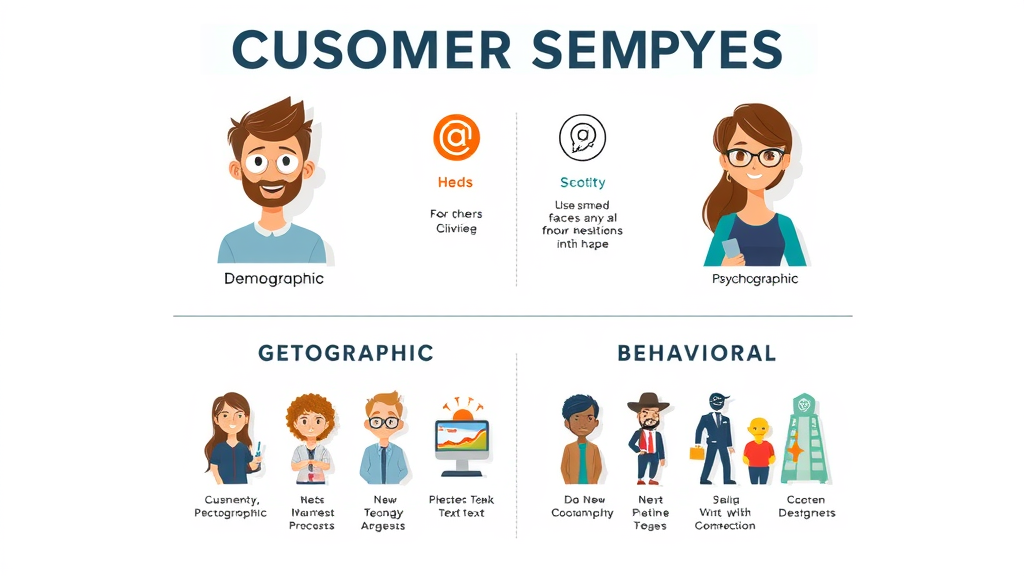
The 4 Types of Customer Segmentation: Demographic, Geographic, Psychographic, and Behavioral

Segmentation Type Definition Key Examples Primary Uses
Demographic Segmentation Divides the market based on demographic data like age, gender, income, education Targeting Gen Z with eco-friendly products; Marketing to high-income earners Product development, tailored messaging, pricing strategies
Geographic Segmentation Segments customers based on location such as country, region, city, or climate Promoting winter wear in northern regions; Location-specific ads Local promotions, logistics planning, market entry strategies
Psychographic Segmentation Groups customers based on lifestyle, values, attitudes, interests Fitness brands targeting health-conscious individuals; Eco-friendly campaigns Brand positioning, message personalization, emotional engagement
Behavioral Segmentation Segments customers by purchasing behavior, brand interaction, product usage Loyalty program for repeat buyers; Seasonal promotions for specific behaviors Loyalty programs, retention campaigns, upselling and cross-selling

infographic of four customer segmentation types: demographic, geographic, psychographic, behavioral

Why Customer Segmentation Matters for Market Segment Success

  • Improves market segment understanding
  • Delivers tailored messages to each customer segment
  • Optimizes segmentation analysis for maximum ROI

The real power of customer segmentation lies in its ability to improve your grasp on each market segment . By mapping out your audience into coherent customer segments , you gain deep insights into what drives each group’s actions. This understanding leads to more efficient segmentation analysis —helping you allocate resources for the highest return on investment. A nuanced segmentation approach empowers marketers to deliver focused content, targeted offers, and memorable experiences that convert more—faster.

Whether you’re aiming to boost customer engagement, fine-tune your product or service , or maximize the value of your marketing campaign , segmenting your customer base is the foundation for long-term success. Each slice of your audience becomes a unique opportunity to connect, solve problems, and drive measurable business outcomes.

Segmentation Analysis: Evaluating Your Customer Base and Data

Gathering and Leveraging Customer Data for Accurate Segmentation

  • Types of data: purchase history, geographic info, psychographic insights
  • Tools for segmentation analysis
  • Best practices for maintaining data quality

data analyst reviewing customer segmentation charts on a modern digital dashboard

Accurate segmentation begins with robust customer data . Collecting and maintaining clean records about your customer base —including purchase history, geographic information, and psychographic segmentation insights—enables meaningful division into actionable groups based on real-world behavior and preferences. Using the right segmentation tool is essential for efficiently managing and visualizing this wealth of data. Many businesses leverage dedicated CRM systems, data analytics platforms, and integrated marketing suites to drive segmentation analysis and uncover hidden patterns in customer behavior .

To ensure your data leads to valuable segmentation, follow best practices like routine data hygiene checks, validating data sources, and integrating feedback mechanisms. This will prevent outdated, inaccurate data from sabotaging your targeting efforts while enabling you to spot emerging trends and shifts within your customer segments .

How to Conduct a Segmentation Analysis

Conducting a successful segmentation analysis means moving methodically from raw customer data to actionable customer segments . Begin by defining your segmentation goals—do you want to personalize your marketing campaigns, improve product development, or increase retention? Next, aggregate high-quality data from internal and external sources and use a segmentation tool to identify clusters of shared traits and behaviors. Statistical techniques like cluster analysis, factor analysis, and predictive modeling play a key role here, making it easier to reveal valuable segments based on evidence—not guesswork.

Once your segments are identified, label and prioritize them based on business potential and strategic fit. Develop distinct personas to guide the tone, timing, and content of your marketing strategies. Review and adjust segments regularly with fresh data to keep your targeting on point as customer preferences evolve.

Common Challenges in Segmenting Customers and Expert Solutions

"Effective customer segmentation starts with a clear understanding of your customer base and iteratively adapts as behaviors shift." – Market Segmentation Strategist

Many businesses struggle with segmentation due to difficulty accessing unified customer data , unclear goals, and the temptation to use one-size-fits-all models. Over-segmentation—making segments too granular—can drain resources without unique benefits, while using stale data risks misaligning offers with real customer needs. To overcome these hurdles, invest in reliable data platforms, involve cross-functional teams, and regularly validate your segments with performance metrics and customer feedback.

The key is to balance depth with actionability so each customer segment can be meaningfully targeted and measured for impact. Update segmentation efforts frequently—in fast-moving industries, even quarterly reviews may be required to stay relevant.

Selecting the Right Segmentation Models for Your Business

Overview of Customer Segmentation Models

  • Demographic segmentation model
  • Psychographic segmentation model
  • Behavioral segmentation model
  • Geographic segmentation model

creative marketing team brainstorming customer segmentation models in a collaborative workspace

Choosing among segmentation models is crucial for aligning your customer segmentation strategy with your business objectives. The four primary models— demographic segmentation , psychographic segmentation , behavioral segmentation , and geographic segmentation —offer unique perspectives for dividing customers into groups. For example, the demographic segmentation model focuses on age, gender, or income, while the behavioral segmentation model centers on habits and purchasing patterns. A well-chosen customer segmentation model ensures your marketing campaign speaks directly to the motivations and needs that drive conversion.

Recognize that each segmentation model has strengths and limitations. Some businesses benefit from combining models, using demographic data as a foundation and refining segments further with behavioral or psychographic traits. The right approach depends on your target audience , product or service , and long-term growth ambitions.

How to Choose a Segmentation Model Aligned with Your Business Goals

Model Target Industry Strengths Limitations
Demographic Retail, Healthcare, Finance Simple data collection, broad applicability Overlooks personal motivations
Geographic Retail, Logistics, Hospitality Effective local targeting, easy mapping Ignores lifestyle differences within regions
Psychographic Luxury Goods, Lifestyle Brands Deep understanding of motivations Requires detailed research; resource-intensive
Behavioral E-commerce, SaaS, Media Responds to real actions, supports personalization Needs comprehensive tracking infrastructure

To pick the best model, clarify your business goals. If personalization is crucial, a behavioral or psychographic approach makes sense. For broad market analysis, start with demographics or geography. Many organizations experiment with multiple segmentation models to find which blend yields actionable, revenue-driving results.

Combining Segmentation Models for Holistic Results

Real-world marketing is rarely simple—customers have complex motivations that cross segments. Combining segmentation models allows you to develop a multidimensional view of your customer base . For instance, an e-commerce retailer may segment customers by age and location, then refine segments based on purchase frequency or product preferences. This hybrid approach uncovers high-value pockets of opportunity and ensures no market segment is overlooked.

Holistic segmentation creates robust profiles used for more than just marketing campaigns—it impacts product development, customer service, and overall brand strategy. Continually revisit your combined models to adapt to shifting trends and new data.

Implementing a Customer Segmentation Strategy: Step-by-Step Guide

What Are the 7 Steps of Segmentation?

  • Define objectives
  • Collect customer data
  • Analyze current customer base
  • Segment customers into groups
  • Develop segmentation models
  • Implement targeting strategies
  • Monitor, review, and adjust segmentation

businessperson pointing at a digital customer segmentation 7-step process in a modern office

Implementing a winning customer segmentation strategy involves a sequential, repeatable process:

  1. Start by defining your objectives : What do you hope to achieve—higher conversions, better retention, improved product fit?
  2. Next, collect comprehensive customer data through surveys, purchase history, web analytics, and social media monitoring.
  3. Analyze your current customer base for commonalities and differences.
  4. Then, segment customers into groups based on the criteria that best align with your goals.
  5. Develop or choose segmentation models that organize these groups for real-world targeting.
  6. Implement targeting strategies —personalized email campaigns, dynamic website content, unique offers—aimed at each segment.
  7. Finally, monitor, review, and adjust your segmentation at regular intervals to sustain success as your market evolves.

Treat segmentation as a continuous cycle rather than a one-off project. The most effective organizations iterate, test, and optimize their segmentation models, ensuring strategies remain relevant as customer preferences and competitive landscapes change.

Practical Examples of Customer Segmentation in Action

  • E-commerce personalization through segmentation
  • Travel companies segmenting customers based on behavior
  • Financial services tailoring products by market segment

retail manager engaging with customers and personalizing product displays based on segmentation

In action, customer segmentation is the engine behind winning marketing strategies across industries. E-commerce brands personalize landing pages, recommendations, and messaging for distinct customer segments based on browsing and purchase behavior. Travel and hospitality companies divide their customer base by travel frequency, destinations, and booking methods to serve up highly relevant promotions.

In financial services, segmentation enables banks and fintechs to create differentiated products for specific demographics, such as student accounts or premium investment services for high-income earners. The result? Increased engagement, boosted loyalty, and a demonstrable increase in marketing ROI.

"Segmentation analysis transforms masses of customers into dynamic, high-value groups."

Advanced Customer Segmentation Tips for Instant Results

Leveraging AI and Data Automation for Segmentation

data scientist utilizing AI interface for customer segmentation analysis

For instant, scalable results, leverage AI-driven segmentation tools and data automation. Advanced algorithms spot micro-patterns and segment customers faster and more precisely than traditional analysis methods. Machine learning can mine customer data across platforms, recognize shifts in customer behavior , and continuously optimize segments for changing preferences.

Data automation removes manual bottlenecks, ensuring real-time updates keep your segmentation strategies on point. Modern platforms sync with CRMs, marketing automation systems, and e-commerce data, providing a unified view that supports actionable segmentation at any scale.

Optimizing Your Segmentation Model for Fast Wins

  • Focus on largest, most responsive segments first
  • Use A/B testing to optimize targeting quickly
  • Continuously refine segments based on feedback

Maximize impact by first targeting your largest, most lucrative segments—those who will yield the highest ROI with the least effort. Use A/B testing to experiment with different messaging, creative, and offers by segment. This iterative approach surfaces what’s working best and enables you to adapt rapidly.

Never let your segments grow stale. Ask for feedback, monitor engagement in real time, and be willing to adjust your approach. Fast wins come from continual learning and rapid implementation across select customer segments .

Segmentation Strategy: Key Pitfalls and How to Avoid Them

  • Over-segmentation leading to inefficiency
  • Using outdated customer data
  • Failing to monitor and adjust segmentation models

marketing strategist reviewing digital segmentation pitfalls on a tablet

Avoid over-complicating your segmentation strategy by ensuring segments are both meaningful and actionable. Too many micro-segments can dilute your efforts and slow campaign delivery, while segments that are too broad risk missing the relevancy customers crave. Keep data fresh—lean on automation and periodic reviews—and consistently monitor the effectiveness of your segmentation models with real-world performance data.

Effective segmentation is never static. The most successful organizations treat their segmentation model as a living framework—constantly evolving in response to changing customer behavior and competitive trends.

People Also Ask: Core Questions on Customer Segmentation

What are the 4 types of customer segmentation?

diverse personas representing four types of customer segmentation

The four primary types of customer segmentation are demographic segmentation (age, gender, income), geographic segmentation (location), psychographic segmentation (lifestyle, attitudes), and behavioral segmentation (purchasing habits and product usage). These categories help businesses tailor their strategies for each customer segment , optimizing campaigns and personalizing experiences for maximum impact.

What is meant by customer segmentation?

Customer segmentation is the process by which companies divide their broader customer base into smaller groups with similar attributes and behaviors. This enables marketers, product managers, and service teams to customize their messaging and offerings for each segment, increasing relevance and improving the overall customer experience . Segmentation is foundational for data-driven decision making.

What are the 4 segments of segmentation?

The core segments in customer segmentation are demographic, geographic, psychographic, and behavioral. Each represents a unique way to group your audience—by who they are, where they live, how they think, and what they do—which, when used together, create a complete picture for highly effective targeting.

What are the 7 steps of segmentation?

The 7 steps are: define your objectives, collect customer data, analyze your customer base, segment customers into groups, develop segmentation models, implement targeting strategies, and finally, monitor, review, and adjust your segmentation for ongoing improvement. Following this cycle ensures segmentation efforts remain aligned with evolving business and customer needs.

Practical FAQs: Customer Segmentation Simplified

  • Q: How often should segmentation analysis be updated? A: Regularly—ideally quarterly or after significant market changes.
  • Q: Can small businesses benefit from segmentation models? A: Absolutely. Even basic customer segments can deliver instant, measurable improvements.
  • Q: What data is most critical for segmentation? A: Combining behavioral, demographic, and transaction data yields the best results.

Summary and Quick Takeaways for Customer Segmentation Success

  • Customer segmentation unlocks targeted marketing, improved ROI, and stronger customer experience
  • Use segmentation models suited to your goals
  • Regularly analyze your customer base for new insights
  • Leverage tools and automation for instant results

business owner reviewing customer segmentation success metrics in a modern office

Start Applying These Customer Segmentation Strategies Today

Start now! Use these actionable customer segmentation tips and models to transform your marketing campaigns and drive measurable impact. The faster you segment, the sooner you’ll see results in retention, engagement, and ROI.

Sources

  • Harvard Business Review – https://hbr.org/2016/03/how-marketers-can-personalize-at-scale
  • Shopify – https://www.shopify.com/blog/customer-segmentation
  • HubSpot – https://blog.hubspot.com/marketing/customer-segmentation
  • SAS – https://www.sas.com/en_us/insights/marketing/customer-segmentation.html

To deepen your understanding of customer segmentation and its practical applications, consider exploring the following resources:

  • “Customer Segmentation: The Ultimate Guide” ( forbes.com ) provides a comprehensive overview of customer segmentation, detailing various types, benefits, and strategies to effectively implement segmentation in your business.

  • “Customer segmentation: Types, models, examples, strategies and more” ( gfk.com ) offers in-depth insights into different segmentation models, complete with real-world examples and strategic approaches to enhance your marketing efforts.

By delving into these resources, you’ll gain valuable knowledge to refine your segmentation strategies and achieve more impactful marketing results.

Smart Marketing Strategy

21 Views

0 Comments

Write A Comment

*
*
Please complete the captcha to submit your comment.
Related Posts All Posts
05.18.2026

infographics aesthetics for the UK Church Leaders Market

Hook: Have you ever wondered why some church messages stick in your memory, while others fade away before the week’s end? The secret might just be the power of infographics aesthetics—a visual spark that keeps your congregation engaged, inspired, and talking long after the Sunday service. What You'll Learn About Infographics Aesthetics for the UK Church Leaders Market How infographics aesthetics enhance engagement within the church context Types of infographic designs—statistical, process, timeline, and comparison—for church leaders Best practices for data visualization in ministry communications Actionable tips for integrating infographics into content marketing strategies Why Infographics Aesthetics Matter for UK Church Leaders “Visual storytelling is no longer optional for church communication—it’s essential to connect in today’s digital landscape.” – Ken Johnstone, Executive Editor, DYLBO Digital Media The Power of Infographic Design in Religious Communication Infographics have emerged as one of the most vital tools for church leaders aiming to make their messages resonate. Infographic design transforms sermons, annual reports, and outreach campaigns into visually captivating stories. By turning key statistics, complex information, and biblical principles into graphics, leaders can add depth to their communication and ensure ideas are easily digestible. In today’s attention economy, a compelling infographic example often speaks louder than several paragraphs of text, especially for those who find numbers or abstract concepts challenging. This visual element helps churches go beyond words, connecting heart and mind while fostering both understanding and recall. Importantly, church audiences often include members of all ages and backgrounds. By deploying graphics that are easy to understand and visually striking, churches ensure their messages reach everyone—making faith more accessible and conversation more lively. Thoughtful infographic design is now a cornerstone of impactful ministry, bridging generational gaps and making every data point memorable for both seasoned congregants and visitors alike. For church leaders interested in practical ways to simplify complex information for their congregations, exploring the benefits of list infographic formats can be especially helpful. These formats break down intricate topics into clear, actionable steps, as discussed in the section on list and comparison infographics for decision-making within this article. Infographics Aesthetics and Audience Engagement Church leaders aiming to foster deeper community involvement often find infographics act as a catalyst for engagement. The visual richness of well-designed infographics aesthetics captures attention in an age where scrolling and skimming are the norm. Church bulletins, event announcements, and social posts are instantly elevated with the addition of graphic elements: charts, icons, and vibrant colour schemes all work together to pique curiosity and boost interaction. Today’s digital audience not only expects but responds to interactive and visually appealing media. Infographics allow for hierarchical information flow, ensuring that the most important points are seen and absorbed first—a valuable technique when tackling complex topics like biblical genealogy or church growth. The clarity and structure offered by thoughtful infographic aesthetics leave little room for misunderstanding, helping leaders serve up vital messages in a form that encourages both learning and discussion. Current Trends in Data Visualization for Faith-Based Content The landscape of data visualization in ministry is evolving rapidly. Churches are moving beyond simple bar graphs and pie charts, embracing creative strategies like art infographic posters, interactive timelines, and animated graphics. This trend leverages modern design principles and technology to create infographics that feel both fresh and relevant, inviting engagement at every touchpoint—from printed newsletters to mobile-first digital campaigns. Recent research findings reveal that churches that integrate new data visualization tools see a measurable uptick in both engagement metrics and message recall. Leaders often use infographics to untangle complex process explanations (e. g. , church volunteer workflows or stewardship journeys), making it easy for the congregation to follow along. Creative visual storytelling, with curated colour palettes that reflect church branding, now sets leading ministries apart in a crowded digital landscape. Core Elements of Effective Infographics Aesthetics Design Principles for Successful Infographic Design Effective infographic design rests on a combination of balance, clarity, and alignment with mission. Every graphic element should drive home a key point, supporting the overall message rather than overshadowing it. It’s vital to use visual hierarchy—employing size, colour scheme, and placement—to guide the viewer’s eye to the most important details. Consistent spacing and alignment create a cohesive feel, making the visual element easy on the eyes and encouraging extended engagement. Ministries designing their next project should start by clearly defining the outcome they hope to achieve with their infographic example. Is it education, inspiration, or a call to action? Each aim requires a slightly different approach, from the data visualizations used to the graphic elements and colour palette chosen. Simplicity remains key—especially with biblical content—ensuring parishioners focus on the heart of the message, supported by easy-to-understand data points. Colour, Typography, and Branding in Infographics Aesthetics Using the right colour scheme and typography is more than an aesthetic choice; it’s a strategic tool in building recognition and trust with your church community. Infographics should reflect established church branding—through consistent use of logo, colour palette, and font families—so each graphic element feels familiar and unified with other materials. Warm neutrals, inviting blues, or joyful golds, for instance, can add depth and emotional resonance that resonates deeply with faith-based audiences. Typography should be clear, readable, and varied in size according to informational hierarchy. Key points or scripture quotes deserve emphasis with larger, bold type. Finally, subtle branding elements—like a watermark or corner logo—tie everything together, ensuring members know at a glance this visual belongs to their spiritual home. These design choices work seamlessly together, creating a cohesive and meaningful visual language for your congregation. Visual Consistency Across Church Communications Visual consistency ensures every infographic, from the poster on the noticeboard to the social media post, works together to reinforce your church’s identity. This means matching colour palettes, font styles, and iconography so materials look intentionally designed, making it easy to understand and instantly recognisable as part of your ministry’s communication suite. Consistent design is especially important as church messages are distributed across platforms—print, web, and presentations. By deploying similar visual elements (like recurring icons or a branded data point style), leaders help build trust and reduce confusion. This also promotes a sense of unity, as both leaders and congregants can quickly assimilate information regardless of the medium. In the world of content marketing for faith-based organisations, maintaining this visual coherence is essential for credibility and professionalism. Data Visualization Techniques for UK Church Leaders UK church leaders have at their fingertips a variety of data visualization techniques. Statistical infographics are perfect for presenting attendance numbers, donation trends, or outreach results; timeline infographics excel at illustrating ministry history or biblical stories. Hierarchical and comparison infographics make it simple to weigh options or showcase growth, while process infographics break down complex church workflows into step-by-step clarity. Choosing the right data visualization technique depends on the goal of your communication. For example, a process infographic can deconstruct complex tasks (such as onboarding new volunteers), while art infographics highlight biblical principles in a visually rich format. The key is to select graphic elements that make information easily digestible and memorable for all age groups, increasing the likelihood of genuine engagement and discussion among congregants. Interactive Infographic Elements to Enhance Engagement Interactive infographics take engagement one step further, transforming passive viewers into active participants. Features such as clickable charts, expandable scripture passages, or animated timelines keep audiences hooked and encourage deeper exploration of faith-based content. Adding interactive elements—like a quiz at the end of a data visualization or animated transitions in a timeline infographic—caters to digital-first audiences, especially younger church members and families. Church leaders should consider interactive infographics for teaching series, virtual Bible studies, or stewardship campaigns. Not only do these designs spark curiosity and dialogue, but they offer valuable feedback through engagement metrics, showing which key points resonated most. As digital communication becomes the norm, interactive infographic design is an investment that pays off in greater connection and understanding within the church community. Types of Infographics for Church Leaders: Exploring Infographics Aesthetics Statistical Infographic Design for Presenting Church Data Presenting church data in a clear and impactful way is no small feat—statistical infographics make it possible. With smart infographic design, annual giving numbers, event attendance, or survey results stop being dry figures and instead become memorable stories. A bar chart can compare growth across years, pie charts can show ministry budget allocation, and data points become instantly accessible—making it easy for both staff and the congregation to see progress and opportunities at a glance. Statistical infographics should use a consistent colour palette and iconography to avoid confusion. Every element, from legend to headline, should focus on clarity, helping leaders showcase key statistics while avoiding information overload. This is especially useful in annual reports or stewardship communications, where conveying transparency and stewardship is paramount. Process Infographic Design for Ministry Systems Complex ministry workflows—such as volunteer onboarding or pastoral care processes—are made much simpler with a well-crafted process infographic. Instead of lengthy text explanations, church leaders can break a complex process down into manageable steps, each accompanied by a graphic element or icon. Visual cues like arrows, coloured boxes, and numbered stages guide viewers, ensuring no step is missed along the journey. These infographics often use a horizontal or vertical flow, and are especially effective when tackling complex topics or workflows that might otherwise be overwhelming. By simplifying complexity into visually engaging steps, process infographic design helps teams collaborate better and congregants engage more confidently with church initiatives. Timeline Infographic Approaches in Storytelling Timeline infographics are a powerful tool for telling stories—whether it’s retracing the history of a local congregation or outlining a sequence of events in the Gospels. By placing events or milestones along a well-structured timeline, church leaders can weave narratives that are visually impactful and easy to understand. Each event or data point uses a graphic marker to guide the eye and add depth to the story, making it much more engaging for all ages. Churches often use timeline infographics to celebrate anniversaries, highlight spiritual growth, or communicate key moments in calendar-based ministry work. By combining dates, icons, and succinct text, timeline infographics transform potentially dry chronology into memorable and meaningful storytelling that sticks. List and Comparison Infographics for Decision-Making List and comparison infographics shine when churches need to simplify complex information for decision-making or educational purposes. A list infographic can illustrate the steps for joining a ministry team, key biblical themes, or discipleship paths—making it easy for viewers to tick off items or reference them later. Comparison infographics, on the other hand, are ideal for weighing church event options, comparing ministry programs, or even helping church boards make data-informed choices. By laying out content side by side using uniform graphic elements and a harmonious colour scheme, comparison infographics help decision-makers spot key differences or similarities at a glance. Such visual aids empower church leaders and congregants alike to engage confidently with ministry options or community opportunities. Art Infographic and Infographic Poster Applications in Church Branding An art infographic or infographic poster can become a centrepiece for church branding, blending faith symbolism with polished design to reinforce ministry values. These visual tools take inspiration from both fine art and modern design, employing vibrant colours, abstract shapes, and sacred motifs to foster inspiration and unity. Placed on a foyer noticeboard or shared digitally, these infographics make visitors feel welcomed and highlight the church’s commitment to creativity and excellence. Infographic posters can also spotlight core values, kingdom initiatives, or upcoming events in a way that feels less like a bulletin and more like a work of art—making it easy to draw in both regulars and newcomers. When art infographics are paired with a church’s unique identity elements, each poster not only communicates information but also helps build long-lasting recognition and connection within the wider community. Incorporating Infographics Aesthetics into Content Marketing Driving Engagement with Infographic Design on Social Media Social media has transformed the way churches connect with both members and seekers—infographic design is the key to standing out in crowded feeds. A single well-crafted post can carry a week’s worth of ministry impact, especially when packed with eye-catching graphic elements and clear, relatable messaging. Infographics easily summarize sermon points, offer bible study highlights, or promote community events, all in a format that’s inviting and easily shareable. Churches can dramatically drive engagement by aligning their colour scheme across posts, ensuring visual consistency that builds brand recognition. Social platforms also allow for interactive infographic experiences: swipe-through carousels, clickable stories, or short infographic videos give congregants more opportunities to connect, comment, and share—making it easy for faith to spread online. Building Trust and Credibility with Data Visualization Highlight biblical living principles with art infographics Share sermon summaries with process infographics Promote events via infographic posters Educate congregations using hierarchical infotext Building trust is foundational in ministry, and transparency is its close companion. By using data visualization—translating complex topics like budgets, participation trends, or program outcomes into visually digestible infographics—church leaders demonstrate openness and care. Members feel respected when the information they need is communicated clearly and attractively, whether in annual reports or weekly newsletters. Effective infographic design not only enhances understanding but also signals professionalism and thoughtfulness. When congregants see their leaders investing in clear, creative communication, they’re more likely to invest their time and energy in ministry, driving participation and trust to new heights. Table: Comparison of Infographic Types for UK Church Leaders Infographic Type Uses in Church Strengths Potential Applications Statistical Infographic Reporting growth, donations, attendance Clear data visualization, easy comparison Annual reports, stewardship updates Process Infographic Outlining steps or systems Clarifies complex process, easy-to-follow Volunteer onboarding, ministry workflows Timeline Infographic Storytelling chronological events Visual narrative, historical overview Church history, Bible timeline, event recaps Comparison Infographic Weighing options, highlighting differences Side-by-side clarity, decision support Ministry choices, programme comparisons Art Infographic/Posters Branding, inspiration, sharing values Highly visual, emotional connection Noticeboards, social media, foyer decor Interactive Infographic Education, digital engagement Engagement, user feedback, memorable Bible studies, stewardship campaigns, youth ministry A short explainer video showing before-and-after case studies of church communication, focusing on the visual transformation using infographic design and resulting engagement improvements. Includes animated transitions between bland and visually appealing infographic content, with voiceover summarizing key benefits for UK church leaders. Key Points from the Video Visual impact of infographics in religious education Case studies: Increased engagement metrics Step-by-step guide to simple infographic design for churches People Also Ask: Infographics Aesthetics in Church Content How can church leaders use infographics in sermons? Church leaders can use infographics in sermons to visually outline scripture passages, highlight important themes, or summarise key points. Incorporating infographics aesthetics on projection screens or printed handouts ensures the congregation has an easy-to-understand reference throughout the message. This combination of spoken word and visual element reinforces learning and helps members connect with the content on a deeper level, making it memorable and actionable. What makes effective infographic design for religious audiences? Effective infographic design for religious audiences hinges on clarity, relevance, and respectful visual storytelling. Key components include a harmonious colour palette aligned with church branding, readable typography, and relatable graphic elements that support rather than distract from the message. Incorporating faith-based symbols and art infographic styles can add depth and emotional resonance, ensuring the congregation feels connected, inspired, and informed. Are there data visualization tools tailored for the UK church sector? Yes, several data visualization tools are popular among UK churches. While mainstream platforms like Canva and Piktochart offer broad features for infographic design, faith-based organisations often use custom templates or ministry-focused plugins that integrate biblical themes or hierarchical infographics. These solutions make it easy for church leaders to represent complex information in a familiar, engaging format suitable for all church communication needs. What are the key components of interactive infographic design for faith-based audiences? The key components of interactive infographic design for faith-based audiences include clickable sections, animated scripture highlights, data points with pop-out explanations, and multimedia integration (like audio or video clips). These elements encourage deeper exploration of content, allow users to navigate at their own pace, and boost engagement—especially with younger or digital-native congregants. How can data visualization foster community engagement within churches? Data visualization can foster community engagement by making church goals, achievements, and plans transparent and inclusive. When congregants see clear, accessible infographics showing progress, opportunities, or impact, they’re more likely to participate, offer feedback, and feel part of the church’s mission. Regular use of infographic design encourages discussion, strengthens trust, and energizes all members to be more engaged with ongoing ministry initiatives. FAQs About Infographics Aesthetics for UK Churches How does infographic design differ from traditional church visuals? Unlike traditional visuals—such as static posters or text-heavy bulletins—infographic design integrates graphic elements, statistical data, and structured layouts for clarity and appeal. This makes complex information more engaging and easy to digest for today’s congregation. Which data visualization methods are most impactful for church reports? Statistical infographics, timeline infographics, and interactive infographic designs are particularly effective for church reports, enabling visual comparison of growth, finances, or ministry outcomes in a way that connects with both staff and lay audiences. How can list infographic formats simplify complex information? List infographics break down complex topics—such as spiritual gifts or discipleship steps—into manageable, easy-to-follow points. This format uses graphic elements and short text to make information quickly scannable and memorable. In what ways does process infographic design support ministry planning? Process infographics visually outline step-by-step tasks or systems, clarifying roles and timelines for volunteers, leaders, or congregants. They help create a cohesive, shared understanding of tasks, supporting more efficient and collaborative ministry planning. What steps do church teams need to start creating effective infographics? Start by identifying the message to communicate, choose the appropriate infographic type, gather data points, design using a consistent colour palette and branding, and test with a small audience for clarity before wider distribution. Best Practices & Key Takeaways for Infographics Aesthetics Align infographic branding with church identity Prioritize clarity in data visualization Utilize interactive and hierarchical infographics for engagement Monitor performance and iterate infographic designs Ready to Elevate Your Church’s Visual Impact? Discover how enhanced infographics aesthetics can unlock new levels of engagement and understanding within your congregation—or start your design journey now with professional guidance from DYLBO Digital Media. Published by Ken Johnstone MBA BSc, Executive Editor at DYLBO digital media & Biblical Living Unlocked Conclusion Embracing infographics aesthetics empowers UK church leaders to communicate with clarity, creativity, and greater impact—sparking deeper engagement and connection within your congregation. If you’re inspired to take your church’s communication to the next level, consider how visual storytelling can complement other aspects of ministry leadership. For a broader perspective on nurturing meaningful connections and making the most of your time with your community, explore insights on intentional engagement and time management from Ben Sasse. Combining effective infographics with thoughtful leadership strategies can help you foster deeper relationships and lasting impact within your congregation. Continue your journey towards more dynamic and purposeful ministry by integrating both visual and relational best practices. Sources Canva – https://canva.com Piktochart – https://piktochart.com Church Marketing Ideas – https://www.churchmarketingideas.com DG UK – https://www.dg.uk.com/insight/infographic-design-uk Visual Story Network – https://www.visualstory.org/research-faith-visuals To further deepen your understanding of infographics aesthetics and their potential within church communications, consider reviewing the resource Infographic Design UK. This page provides professional insights and practical advice tailored to creating visually compelling and effective infographics, with an emphasis on clarity and strategic messaging. Additionally, the article Research on Visuals and Faith: Key Findings delves into the impact of visuals in religious and faith-based contexts, highlighting best practices and research-backed outcomes for increasing engagement and comprehension. If you’re serious about leveraging infographics aesthetics in your church leadership, these resources will give you actionable strategies and a firmer foundation for transforming your visual communication.

01.19.2026

Why Local Service Businesses Must Embrace AI Music Technology for Growth

Update The Revolution of AI in Music: A Business Imperative The landscape of the music industry is shifting significantly due to the integration of artificial intelligence (AI). Once seen as a tool for streamlining production, AI is now revolutionizing how music is created, marketed, and consumed. While a study shows 44% of U.S. listeners express discomfort with AI-generated songs, the reality paints a different picture. Artists like Xania Monet, who have utilized AI in their work, are achieving Billboard success, indicating that consumer behavior is more accepting than their sentiments suggest. Navigating Consumer Sentiment and Market Dynamics This dichotomy between consumer discomfort and engagement is crucial for small to medium service-based businesses. Just as Bad Bunny leveraged data analytics to rise in popularity, businesses in various sectors must harness these insights to remain relevant. Music listeners today engage with personalized streaming experiences, and similar data-driven marketing can help service businesses tailor their offerings based on consumer preferences. Empowering Creativity: AI as an Ally Platforms like Amper Music and AIVA demonstrate how AI democratizes music creation. Musicians, whether beginners or seasoned professionals, can utilize these tools to enhance their projects without losing the emotional depth that defines their artistry. For local service-based industries, embracing AI can foster innovation and creativity in service offerings, leveraging personalized experiences to address customer needs more effectively. Ethics and Authenticity in AI Music Creation As businesses explore the benefits of AI integration, they must also confront the ethical considerations surrounding copyright and artist ownership. The emergence of AI-generated music raises critical questions: How do we protect our creative rights in an increasingly automated world? Striking a balance between innovation and authenticity is essential for maintaining trust in the local community while adapting to new technologies. Conclusion: Embracing AI for Sustainable Growth The fusion of AI into music signifies more than just a technological trend; it has profound implications for how businesses operate and interact with consumers. By recognizing the potential of AI, service-based industries can enhance their offerings, ensuring they are proactive rather than reactive in this evolving marketplace. As we move forward, collaborating with AI can not only drive efficiency but also foster deeper connections between businesses and their customers. Now is the time for your business to explore AI tools to ensure sustained growth.

01.18.2026

Critical Insights from LA Wildfires: Essential Disaster Prep for Businesses

Update Understanding the Lessons from the LA WildfiresThe devastating wildfires that ravaged Los Angeles a year ago will be remembered as not only a natural disaster but also as a wake-up call for businesses in service sectors. Journalist Jacob Soboroff's *Firestorm* draws attention to the complex nature of these disasters, aggravated by hurricane-force winds and prolonged dry conditions that left communities like Pacific Palisades unprepared. The need for robust emergency planning and a proactive approach to disaster management has never been clearer. Businesses must recognize the importance of not just surviving a crisis but thriving in its aftermath through diligent preparation.Be Proactive: Preparing Your Business for Future DisastersFor small and medium-sized service businesses, the insights garnered from recent events highlight a crucial takeaway: it is imperative to prepare for future disasters. The landscape of Los Angeles features a significant portion of small enterprises; hence, their resilience is essential to the economic fabric of the community. Business owners should take steps to evaluate their vulnerabilities, establish crisis communication plans, and develop detailed recovery strategies—ensuring the ability to maintain operations during and after emergencies.The Power of Community Collaboration in CrisisThe aftermath of the wildfires has illustrated the undeniable significance of community support. The Los Angeles Area Chamber of Commerce underscores that approximately 93% of local businesses are small, and collective recovery efforts rely on the strength of these enterprises. By fostering relationships within the community and collaborating with local organizations, businesses can significantly enhance their resilience. This includes sharing resources, participating in community drills, and offering assistance to one another during recovery.Adapting Policies for Improved Disaster ResilienceLooking forward, adapting current policies to incorporate lessons learned from the LA wildfires is essential. Businesses are encouraged to engage in ongoing disaster response training and participate in community preparedness initiatives. By aligning building practices and urban policies with disaster resilience principles, we can create safer environments that adequately mitigate future risks. Proactive engagement ensures not only preparedness but also enhances the ability to recover swiftly when unforeseen disasters strike.Action Steps for Business OwnersAs we reflect on the anniversary of these fire tragedies, it is essential for small business owners to put these insights into action. This can be achieved through creating or updating disaster response plans, ensuring adequate insurance coverage, and taking part in community safety initiatives. These steps not only protect individual businesses but also fortify the local economy against future disruptions.

Terms of Service

Privacy Policy

Core Modal Title

Sorry, no results found

You Might Find These Articles Interesting

T
Please Check Your Email
We Will Be Following Up Shortly
*
*
*